install.packages("tidyverse") # first install this package
install.packages("remotes") # second install this package to download the dataBase R Descriptive Statistics
Packages are collections of R functions, data, and code compiled in a well-defined format. R functions are like the verbs of the R coding language, they tell your computer what action to make with sets of information. A function is usually defined by a keyword and then parenthesis. Functions can be built by yourself or pre-built.
Some packages come pre-installed in R, hwoever, the majority do not, so you need to install them first using the r function install.packages
After installing the packages we need to attach the package. You will always need to reattach the a package in order to use it when you restart R. You can do this by using the function library() and the name of the package.
In the following examples we will be using a collection of data sets I have cleaned and you will download by using the following code:
# This line of code installs a data package saved on github that I
# created
remotes::install_github("hbdaarstad/RandomData")
Now, we can begin using functions found in the tidyverse package and data from my package RandomData. Let’s work with our first data set, race_stats.
?race_stats # description of the data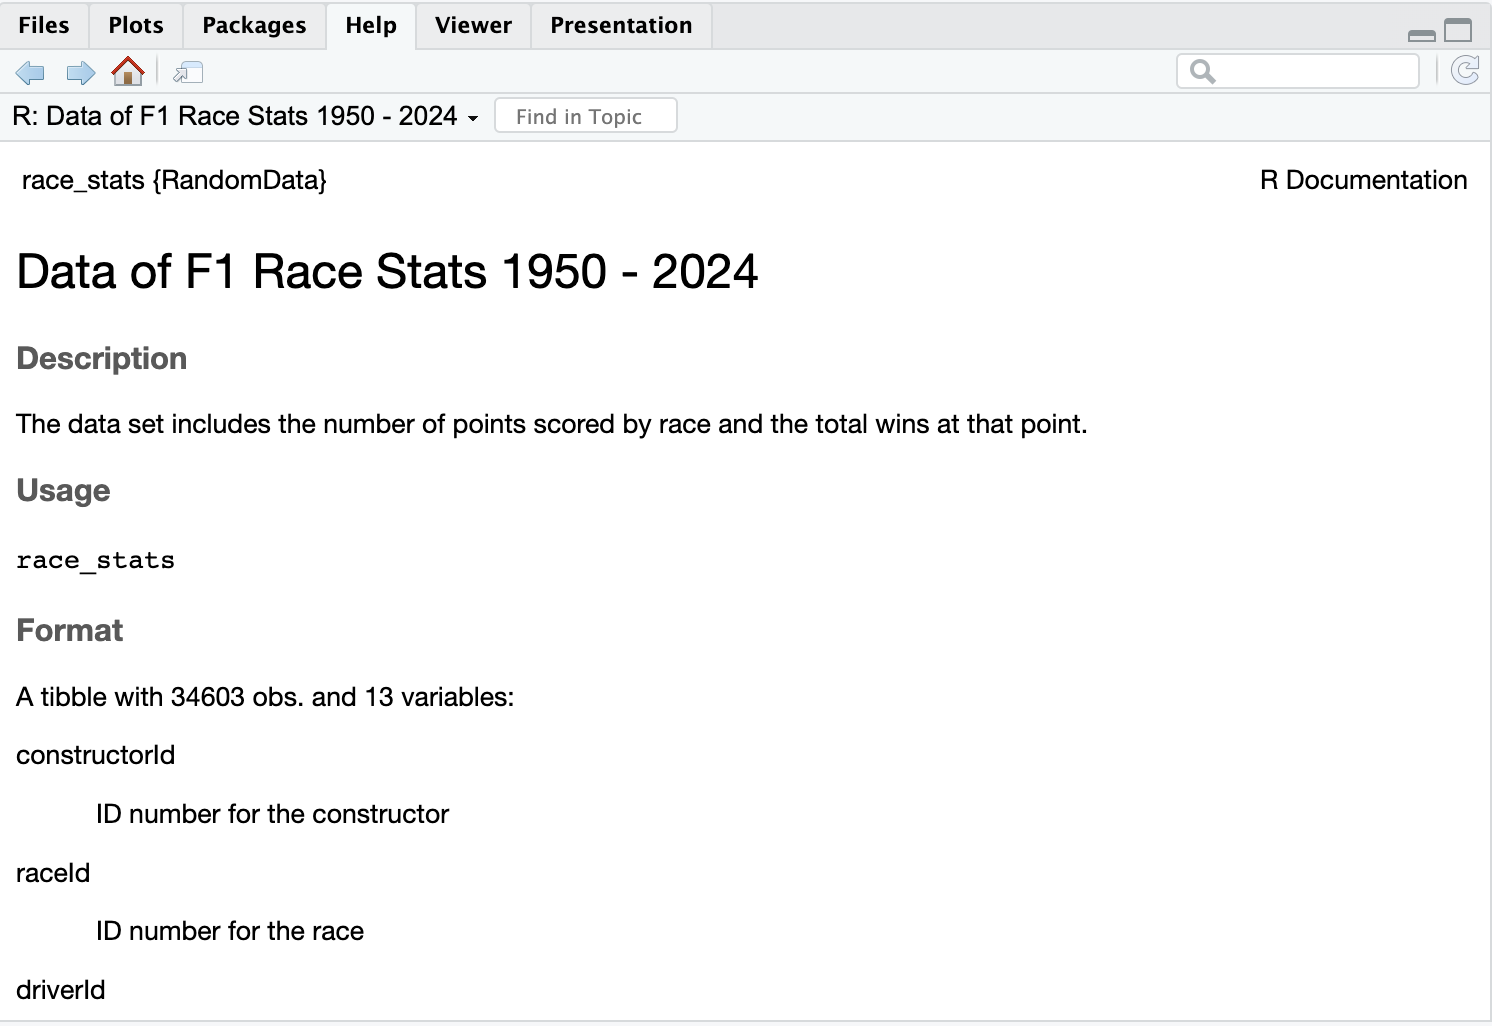
Picturing the Data
The head() and str() allow us to get a snap shot of the data and see what is in it and what data types we are working with. head() shows us the first six observations of each variable, while str() shows us the structure of each variable.
dat <- race_stats

head(dat)
# A tibble: 6 × 30
constructorId raceId driverId statusId circuitId race_name year circuit
<dbl> <dbl> <dbl> <dbl> <dbl> <chr> <dbl> <chr>
1 1 1000 4 11 11 Hungarian Gran… 2018 Hungar…
2 1 1000 4 11 11 Hungarian Gran… 2018 Hungar…
3 1 1000 4 11 11 Hungarian Gran… 2018 Hungar…
4 1 1000 4 11 11 Hungarian Gran… 2018 Hungar…
5 1 1000 4 11 11 Hungarian Gran… 2018 Hungar…
6 1 1000 4 11 11 Hungarian Gran… 2018 Hungar…
# ℹ 22 more variables: country <chr>, alt <dbl>, points <dbl>, laps <dbl>,
# fastestLapTime <chr>, fastestLapSpeed <chr>, constructor <chr>,
# constructor_nationality <chr>, forename <chr>, surname <chr>,
# driver_nationality <chr>, status <chr>, lap_number <dbl>, time <dbl>,
# pitlap_number <dbl>, pitnumber <dbl>, pit_time <dbl>, duration <chr>,
# quali_position <dbl>, q1 <chr>, q2 <chr>, q3 <chr>str(dat) # structure of datasetspc_tbl_ [630,584 × 30] (S3: spec_tbl_df/tbl_df/tbl/data.frame)
$ constructorId : num [1:630584] 1 1 1 1 1 1 1 1 1 1 ...
$ raceId : num [1:630584] 1000 1000 1000 1000 1000 1000 1000 1000 1000 1000 ...
$ driverId : num [1:630584] 4 4 4 4 4 4 4 4 4 4 ...
$ statusId : num [1:630584] 11 11 11 11 11 11 11 11 11 11 ...
$ circuitId : num [1:630584] 11 11 11 11 11 11 11 11 11 11 ...
$ race_name : chr [1:630584] "Hungarian Grand Prix" "Hungarian Grand Prix" "Hungarian Grand Prix" "Hungarian Grand Prix" ...
$ year : num [1:630584] 2018 2018 2018 2018 2018 ...
$ circuit : chr [1:630584] "Hungaroring" "Hungaroring" "Hungaroring" "Hungaroring" ...
$ country : chr [1:630584] "Hungary" "Hungary" "Hungary" "Hungary" ...
$ alt : num [1:630584] 264 264 264 264 264 264 264 264 264 264 ...
$ points : num [1:630584] 4 4 4 4 4 4 4 4 4 4 ...
$ laps : num [1:630584] 69 69 69 69 69 69 69 69 69 69 ...
$ fastestLapTime : chr [1:630584] "1:22.090" "1:22.090" "1:22.090" "1:22.090" ...
$ fastestLapSpeed : chr [1:630584] "192.125" "192.125" "192.125" "192.125" ...
$ constructor : chr [1:630584] "McLaren" "McLaren" "McLaren" "McLaren" ...
$ constructor_nationality: chr [1:630584] "British" "British" "British" "British" ...
$ forename : chr [1:630584] "Fernando" "Fernando" "Fernando" "Fernando" ...
$ surname : chr [1:630584] "Alonso" "Alonso" "Alonso" "Alonso" ...
$ driver_nationality : chr [1:630584] "Spanish" "Spanish" "Spanish" "Spanish" ...
$ status : chr [1:630584] "+1 Lap" "+1 Lap" "+1 Lap" "+1 Lap" ...
$ lap_number : num [1:630584] 68 15 55 44 27 38 4 33 67 36 ...
$ time : num [1:630584] 4920 5040 5100 5100 4980 4980 5160 5040 5100 4980 ...
$ pitlap_number : num [1:630584] 39 39 39 39 39 39 39 39 39 39 ...
$ pitnumber : num [1:630584] 1 1 1 1 1 1 1 1 1 1 ...
$ pit_time : num [1:630584] 58107 58107 58107 58107 58107 ...
$ duration : chr [1:630584] "21.795" "21.795" "21.795" "21.795" ...
$ quali_position : num [1:630584] 11 11 11 11 11 11 11 11 11 11 ...
$ q1 : chr [1:630584] "1:18.208" "1:18.208" "1:18.208" "1:18.208" ...
$ q2 : chr [1:630584] "1:35.214" "1:35.214" "1:35.214" "1:35.214" ...
$ q3 : chr [1:630584] "\\N" "\\N" "\\N" "\\N" ...
- attr(*, "spec")=
.. cols(
.. constructorId = col_double(),
.. raceId = col_double(),
.. driverId = col_double(),
.. statusId = col_double(),
.. circuitId = col_double(),
.. race_name = col_character(),
.. year = col_double(),
.. circuit = col_character(),
.. country = col_character(),
.. alt = col_double(),
.. points = col_double(),
.. laps = col_double(),
.. fastestLapTime = col_character(),
.. fastestLapSpeed = col_character(),
.. constructor = col_character(),
.. constructor_nationality = col_character(),
.. forename = col_character(),
.. surname = col_character(),
.. driver_nationality = col_character(),
.. status = col_character(),
.. lap_number = col_double(),
.. time = col_double(),
.. pitlap_number = col_double(),
.. pitnumber = col_double(),
.. pit_time = col_double(),
.. duration = col_character(),
.. quali_position = col_double(),
.. q1 = col_character(),
.. q2 = col_character(),
.. q3 = col_character()
.. )
- attr(*, "problems")=<externalptr> Base R Descriptive Stat Functions
First, let’s find the minimum speed recorded and the maximum speed recorded during the fastest laps for each race. Since fastest lap time is a character we need to change it from a character to a numeric value and lets remove any NAs.
# change NA to 0s and to numeric
dat$fastestLapSpeed <-as.numeric(
    ifelse(dat$fastestLapSpeed >= 0, dat$fastestLapSpeed, 0)
    )
Min and Max
min(dat$fastestLapSpeed)[1] 0max(dat$fastestLapSpeed)[1] 255.014range(dat$fastestLapSpeed)[1] 0.000 255.014Mean
- The mean is average value of all the numbers in a set.
mean(dat$fastestLapSpeed)[1] 201.4552Median
- The median is the middle value in a set of numbers when they are ordered from least to greatest.
median(dat$fastestLapSpeed)[1] 203.003First and Third Quartiles
- The first quartile range is the value under which 25 percent of the data points are found when they are arranged in increasing order, and the third quartile range is where 75 percent of the data points are found when they are arranged in increasing order
quantile(dat$fastestLapSpeed, 0.25) 25%
191.142 quantile(dat$fastestLapSpeed, 0.75) 75%
214.339 IQR
- The IQR is the difference between the first and third quartile.
IQR(dat$fastestLapSpeed)[1] 23.197Standard Deviation and Variance
- Variance is the average squared difference between data points in a set, which measures how much the values in a set vary from each other. While Standard Deviation is the measure of how far the values in a set are from the mean
sd(dat$fastestLapSpeed)[1] 23.22281var(dat$fastestLapSpeed)[1] 539.2991